THERMAL INTEGRITY PROFILING – INSTRUMENTATION AND ANALYSIS
Thermal Integrity Profiler (TIP) testing was performed by means of Thermal Wire® cables and Thermal Acquisition Ports (TAPs). The TIP system, manufactured by Pile Dynamics, Inc (PDI) in association with FGE, reads concrete temperatures during curing using cables embedded in the concrete.
The Thermal Wire cables consist of temperature sensors spaced every one foot along the length of a wire. For this D-Wall panel, seven Thermal Wire Cables were attached along the full length of each of the reinforcement cages prior to placement within panel. Two such reinforcement cages, Type 1A were installed within the panel. Once the cages were installed to agreed depth, a TAP box was attached to each wire, and data acquisition began prior to concrete placement.
During curing of the concrete, the hydrating cement generates heat, increasing the temperature in the shaft. Every 15 minutes, the TAP units automatically record the measured temperature at each sensor location along the length of the wire, generating a profile of temperature versus depth at each increment of time. After the concrete peak temperature has been achieved, each TAP was connected to a TIP processing unit and the data was downloaded for further interpretation in the office.
The TIP results may be evaluated for concrete quality and for location of the reinforcing cages. The overall average temperature for all Thermal Wire readings over the embedded depths can be directly related to the overall volume of concrete installed. Panel integrity may be assessed based on the average temperature measurements from each Thermal Wire at each depth increment. If the measured average temperature versus depth is consistent, the panel is considered to be uniform in shape and quality. Bulges can be identified as localised increases in average temperature, while insufficient concrete quality or section reductions can be identified as localized decreases in average temperature. Anomalies present over more than ten percent of the effective cross-sectional area are normally seen in multiple Thermal Wires at the same depth. Because soil and/or slurry pockets produce no heat, areas of soil intrusion or inclusion are indicated by lower local temperatures.
Reinforcement cage location can be estimated based on the relative temperature difference between an individual Thermal Wire and the average of all wires. Higher individual Thermal Wire temperatures indicate the wire is closer to the center of the shaft, or near a local bulge, while lower individual Thermal Wire temperatures indicate the wire is closer to the soil-pile interface, or a local defect. By viewing diametrically opposite Thermal Wires, instances where a lateral shift of the reinforcing cage has occurred can be determined, if one wire temperature is higher than average and the diametrically opposite wire temperature is lower than average.
PILE DETAILS
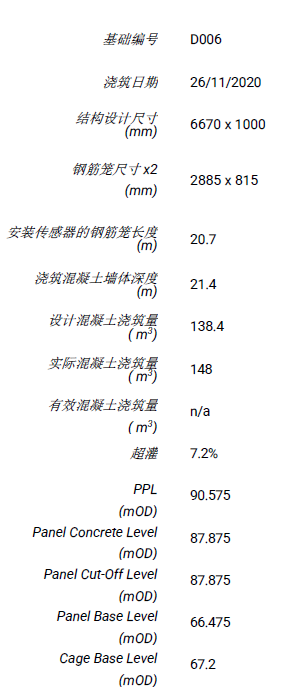
Panel details were provided by the client as follows:

RESULTS
Factual Data
TIP results include the measured temperature versus depth. Given sufficient thermal measurement points, the Thermal Profiles present the measured temperature versus depth for each active sensor at the selected time interval.
The optimal time for the pile profile generally occurs between one half the time to peak temperature and the time of peak temperature. The peak temperature for this pile type was approximately 82 hours after placement.
In general, temperature variations of +/- 2.2 degrees Celsius (+/- 4 °F) are within normal range for TIP results due to variations in the cable location and unavoidable shifting or movement of reinforcing cage during installation in the panel excavation. Anomalies would be indicated by abrupt reductions in temperature at a particular depth.
The thermal results are presented in Figures 1 to 5. Figures 1 to 3 present the measured Temperature (°C) vs. Depth (meters) for fourteen wires as recorded at the following times: immediately after placement (Fig.1), halfway to peak temperature (Fig. 2) and at peak temperature (Fig. 3). The orientation of the wires is shown in Figure 7.
Figure 4, shows the Temperature vs. Depth on each panel, overlaid with the average temperature from all wires. Figure 5 shows the 2 wires place at the panel edges. Details of the panel configuration as planned is shown in Figure 6.
Figure 8 confirms the wire details used and Figure 9 shows photographs taken during the installation process.
Adjustments and Assumptions
Temperature roll-off at the top of a panel is caused by heat loss due to the concrete/air interface. Temperature roll-off at the bottom of a panel is caused by heat loss due to the concrete/soil interface at the panel base. The roll-off at both ends of a uniform shaft follows a hyperbolic tangent curve. By superimposing the hyperbolic tangent onto the measured temperature curve in the roll-off zone, the difference between the measured temperatures and the hyperbolic tangent curve allows for the computation of the effective shape in the roll-off zone.
Interpretation
From the factual data provided in Temperature vs. Depth, no significant variations in profile indicative of major anomalies are apparent.
There is an apparent increase in temperature around 13m depth which is consistent with the insertion of the polystyrene box-out panels attached to the outside of the reinforcement cages. Polystyrene acts as an insulator of heat and subsequently did not allow heat dissipation in to the surrounding soil.
Variations towards the panel bases at the edges are noted and these features are consistent with the method of excavation used.
The overall thermal signature indicates the panel is continuous with no abrupt reductions in temperature which is indicative of major anomalies over the tested length. All fourteen wires operated sufficiently throughout the monitoring phase.